We clustered the metagenomic predicted genes using the cascaded-clustering workflow of the MMseqs2 software [1] (–cov-mode 2 -c 0.8 –min-seq-id 0.3). We discarded from downstream analyses the singletons and clusters with a size below a threshold identified after applying a broken-stick model (Figure 2). Next, the cascaded clustering created 32,465,074 gene clusters (Table 1).
Table 1. Cascaded clustering results.
| Initial genes | Redundancy step | Cluster step 0 | Cluster step 1 | Cluster step 2 | Cluster step 3 |
|---|---|---|---|---|---|
| 322,248,552 | 137,568,876 | 67,369,644 | 42,891,295 | 35,267,181 | 32,465,074 |
We used a broken-stick model approach to identify the size of the cluster to keep
 Figure 1. Cluster size distribution. The red line indicates the “breaking point” of the distribution, which corresponds to clusters of ~10 ORFs.
For the downstream processing, we kept 3,003,897 gene clusters (83% of the original genes) after filtering out any gene cluster that contained less than 10 genes removing 9,549,853 clusters and 19,911,324 singletons.
Table 2. Cascaded clustering results after parsing.
| Total | Clusters ≥ 10 ORFs | Clusters 1< ORFs < 10 | Singletons | |
|---|---|---|---|---|
| Clusters | 32,465,074 | 3,003,897 | 9,549,853 | 19,911,324 |
| ORFs | 322,248,552 | 268,467,763 | 33,869,465 | 19,911,324 |
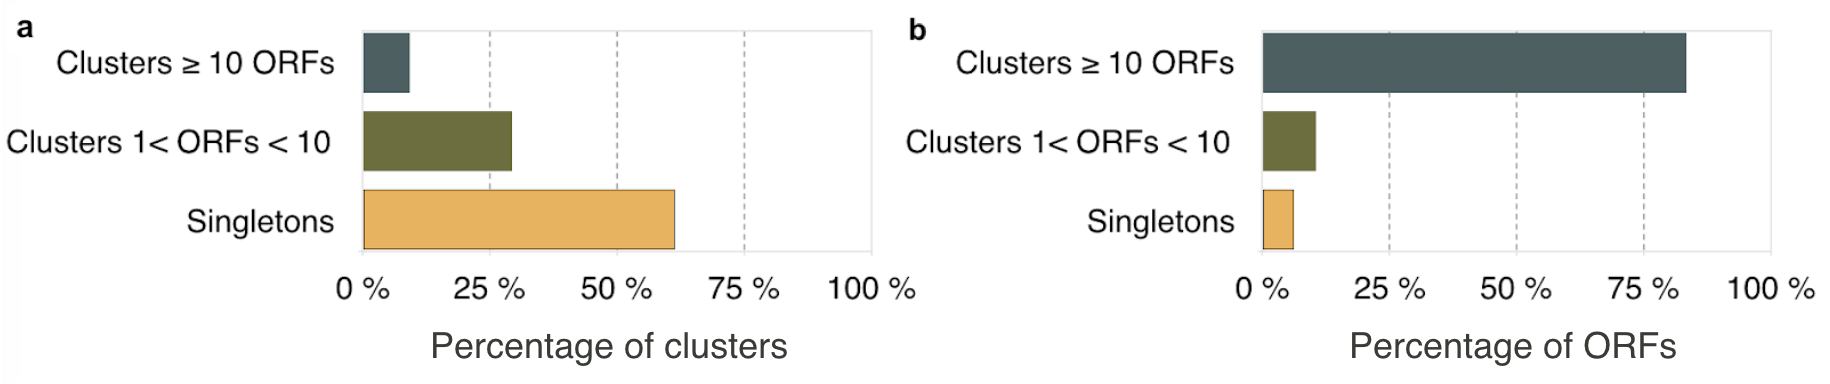 Figure 1. Clustering results: (a) Percentage of clusters in the different sets and (b) percentage of ORFs in the different cluster sets.
The input for the script clustering.sh is the multi-fasta file containing the predicted ORFs (amino acids). The sequences are clustered down to 30% sequence similarity and the results are parsed by the scripts clustering_res.sh and cluster_info.sh. From the parsing we obtain a sequence database of the clusters, tables containing information about the cluster representative, the size and the cluster members and we identified the set of clusters with more than 10 ORFs, those with less and the set of singletons.
An example of the script usage can be found here:
“clustering.sh” (script calling the cascaded clustering program of MMSeqs2):

    input: “data/gene_prediction/TARA_OSD_GOS_malaspina_hmpI-II.fasta.gz”
    output: “data/mmseqs_clustering/marine_hmp_db/marine_hmp_db_03112017” & “/data/mmseqs_clustering/marine_hmp_db/marine_hmp_db_03112017_clu”

“clustering_res.sh” & “clustering_info.sh”:

    input: The output DBs from “clustering.sh” and the orfs fasta file
    output: Files in “/data/mmseqs_clustering/” folder
        marine_hmp_db_03112017_clu.tsv (clusters, long format)
        marine_hmp_db_03112017_clu_wide.tsv (clusters, wide format, first column = representative)
        marine_hmp_db_03112017_clu_size.tsv (clusters representative - size)
        marine_hmp_db_03112017_clu_rep.tsv (clusters representatives)
        marine_hmp_db_03112017_clu_fa (.index) (cluster sequence DB)
        marine_hmp_db_03112017_clu_ge10.tsv (clusters with more than 10 members)
        marine_hmp_db_03112017_singletons.txt (clusters with only one member)
        marine_hmp_db_03112017_clu_info.tsv (info about cluster ID, size, ORFs length)
[1] Finn, R. D., Clements, J., & Eddy, S. R. (2011). HMMER web server: interactive sequence similarity searching. Nucleic Acids Research, 39(Web Server issue), W29–W37.
[2] El-Gebali, S., Mistry, J., Bateman, A., Eddy, S. R., Luciani, A., Potter, S. C., Qureshi, M., Richardson, L. J., Salazar, G. A., Smart, A., Sonnhammer, E. L. L., Hirsh, L., Paladin, L., Piovesan, D., Tosatto, S. C. E., & Finn, R. D. (2019). The Pfam protein families database in 2019. Nucleic Acids Research, 47(D1), D427–D432.